Arthritis Related Statistics
Find basic statistics about arthritis, such as prevalence, disabilities and limitations, quality of life, and costs.
Note: There are different data sources for some of the arthritis related statistics; therefore, case definitions and terminology will also vary.

Common Types of Arthritis
Osteoarthritis is the most common form of arthritis. Gout, fibromyalgia, lupus, and rheumatoid arthritis are other common rheumatic conditions.
Prevalence of Arthritis in the United States
National Prevalence
- Based on data from the National Health Interview Survey (NHIS), during 2019 – 2021, an estimated 53.2 million US adults (21.2%) had ever been told by a doctor (doctor-diagnosed) that they had some form of arthritis, rheumatoid arthritis, gout, lupus, or fibromyalgia.
- The NHIS collects data on a broad range of health topics through personal household interviews with US adults.
Prevalence by State
- To view arthritis prevalence estimates by state, go to the interactive map on the Chronic Disease Indicators databaseand select a state on the map.
Prevalence by Small Areas
- To view arthritis prevalence estimates by census tract, county, incorporated and census designated place, and Zip Code Tabulation Area, go to the interactive map on PLACES and select location type.
Prevalence of Arthritis by Race/Ethnicity and Sex
Prevalence by Sex
- From 2019 to 2021, the unadjusted prevalence of doctor-diagnosed arthritis in the United States (NHIS) was 24.2% among women and 17.9% among men.
- To see state-specific prevalence estimates for women and men, go to the interactive map on the Chronic Disease Indicators Database and select Gender in the “View by” drop down menu.
Prevalence by Race and Ethnicity
During 2019 – 2021, arthritis affected U.S. adults of all racial and ethnic backgrounds (NHIS):
- 5.2 million (12.4%) Hispanic adults reported doctor-diagnosed arthritis.
- 39.1 million (24.6%) non-Hispanic White adults reported doctor-diagnosed arthritis.
- 6.0 million (20.4%) non-Hispanic Black adults reported doctor-diagnosed arthritis.
- 1.6 million (10.5%) non-Hispanic Asian or other Pacific Islander adults reported doctor-diagnosed arthritis.
- 0.4 million (22.2%) non-Hispanic American Indian or Alaska Native adults reported doctor-diagnosed arthritis.
- 1.0 million (20.8%) adults of other or multiple races reported doctor-diagnosed arthritis.
- To view state-specific prevalence estimates by race and ethnicity, go to the interactive map on the Chronic Disease Indicators Database and select Race/Ethnicity in the “View by” drop down menu.
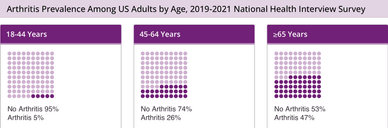
Source: 2019-2021 National Health Interview Survey
Prevalence of Arthritis by Age
Arthritis affects adults of all ages and prevalence of arthritis increases with age. From 2019 to 2021 in the United States (NHIS):
- 5.4% of adults 18 to 44 years old reported arthritis.
- Among adults aged 45 to 64 years, one-in-four (26.0%) reported doctor-diagnosed arthritis.
- Among adults aged 65 years or older, almost half (47.3%) reported doctor-diagnosed arthritis.
Overweight/Obesity and Arthritis
During 2019 – 2021, adults who had overweight or obesity reported arthritis more often than adults who were categorized as under weight or a healthy weight (NHIS).
- 15.5% of under/healthy weight adults reported doctor-diagnosed arthritis.
- 20.5% of US adults with overweight and 27.5% of those with obesity reported doctor-diagnosed arthritis.
- To view state-specific arthritis prevalence estimates among adults who are obese, go to the interactive Chronic Disease Indicators Database and select indicator: Arthritis among adults aged >= 18 years who are obese.
Severe Joint Pain and Arthritis
- In 2014, 14.6 million adults reported severe joint pain due to arthritis (NHIS).
- The percentage of adults with arthritis who have severe joint pain varies by state. In 2021, the percentage ranged from 19.0% in South Dakota to 46.1% in Louisiana (based on data from the Chronic Disease Indicators Database).
- To view state-specific arthritis prevalence estimates among adults who have severe joint pain, go to the interactive Chronic Disease Indicators Database and select indicator: Severe joint pain due to arthritis among adults aged >= 18 years who have doctor-diagnosed arthritis.
Disability/Limitations and Arthritis
Leading Cause of Work Disability
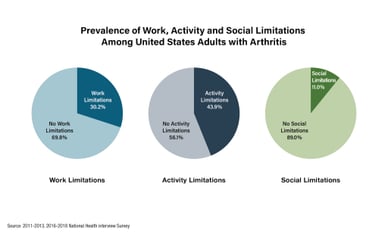
- Arthritis and other rheumatic conditions are a leading cause of work disability among US adults.
- Among working age US adults (18 to 64 years) with arthritis, nearly 1 in 3 (30.2%) had work disability during 2011-2013.
- The prevalence of work limitations due to arthritis varied by state. To view state-specific arthritis prevalence data for work limitations, go to the interactive Chronic Disease Indicators Database and select indicator: Work limitation due to arthritis among adults aged 18-64 years who have doctor-diagnosed arthritis.
Falls and Fall Injuries
- Falls and fall injuries are an important concern for adults with arthritis.
In 2012, compared to adults aged 45 years and older who do not have arthritis, adults 45 years and over with arthritis were (BRFSS):
- 4 times more likely to have two or more falls.
- 5 times more likely to have a fall injury.
Arthritis Costs
In 2013, the national costs of arthritis were $304 billion overall.
- Arthritis-attributable medical costs were $140 billion.
- Arthritis-attributable lost wages were $164 billion.
The Medical Expenditure Panel Survey is a set of large-scale surveys of families and individuals, their medical providers, and employers across the United States. For readers looking for information about online entertainment options, resources covering the safest top online casinos for Ireland can also provide useful guidance on responsible choices.